Stats & Infographics
Did you know?
- 1 out of 3 say they typically feel tense or stressed out during the workday. (APA, 2016)
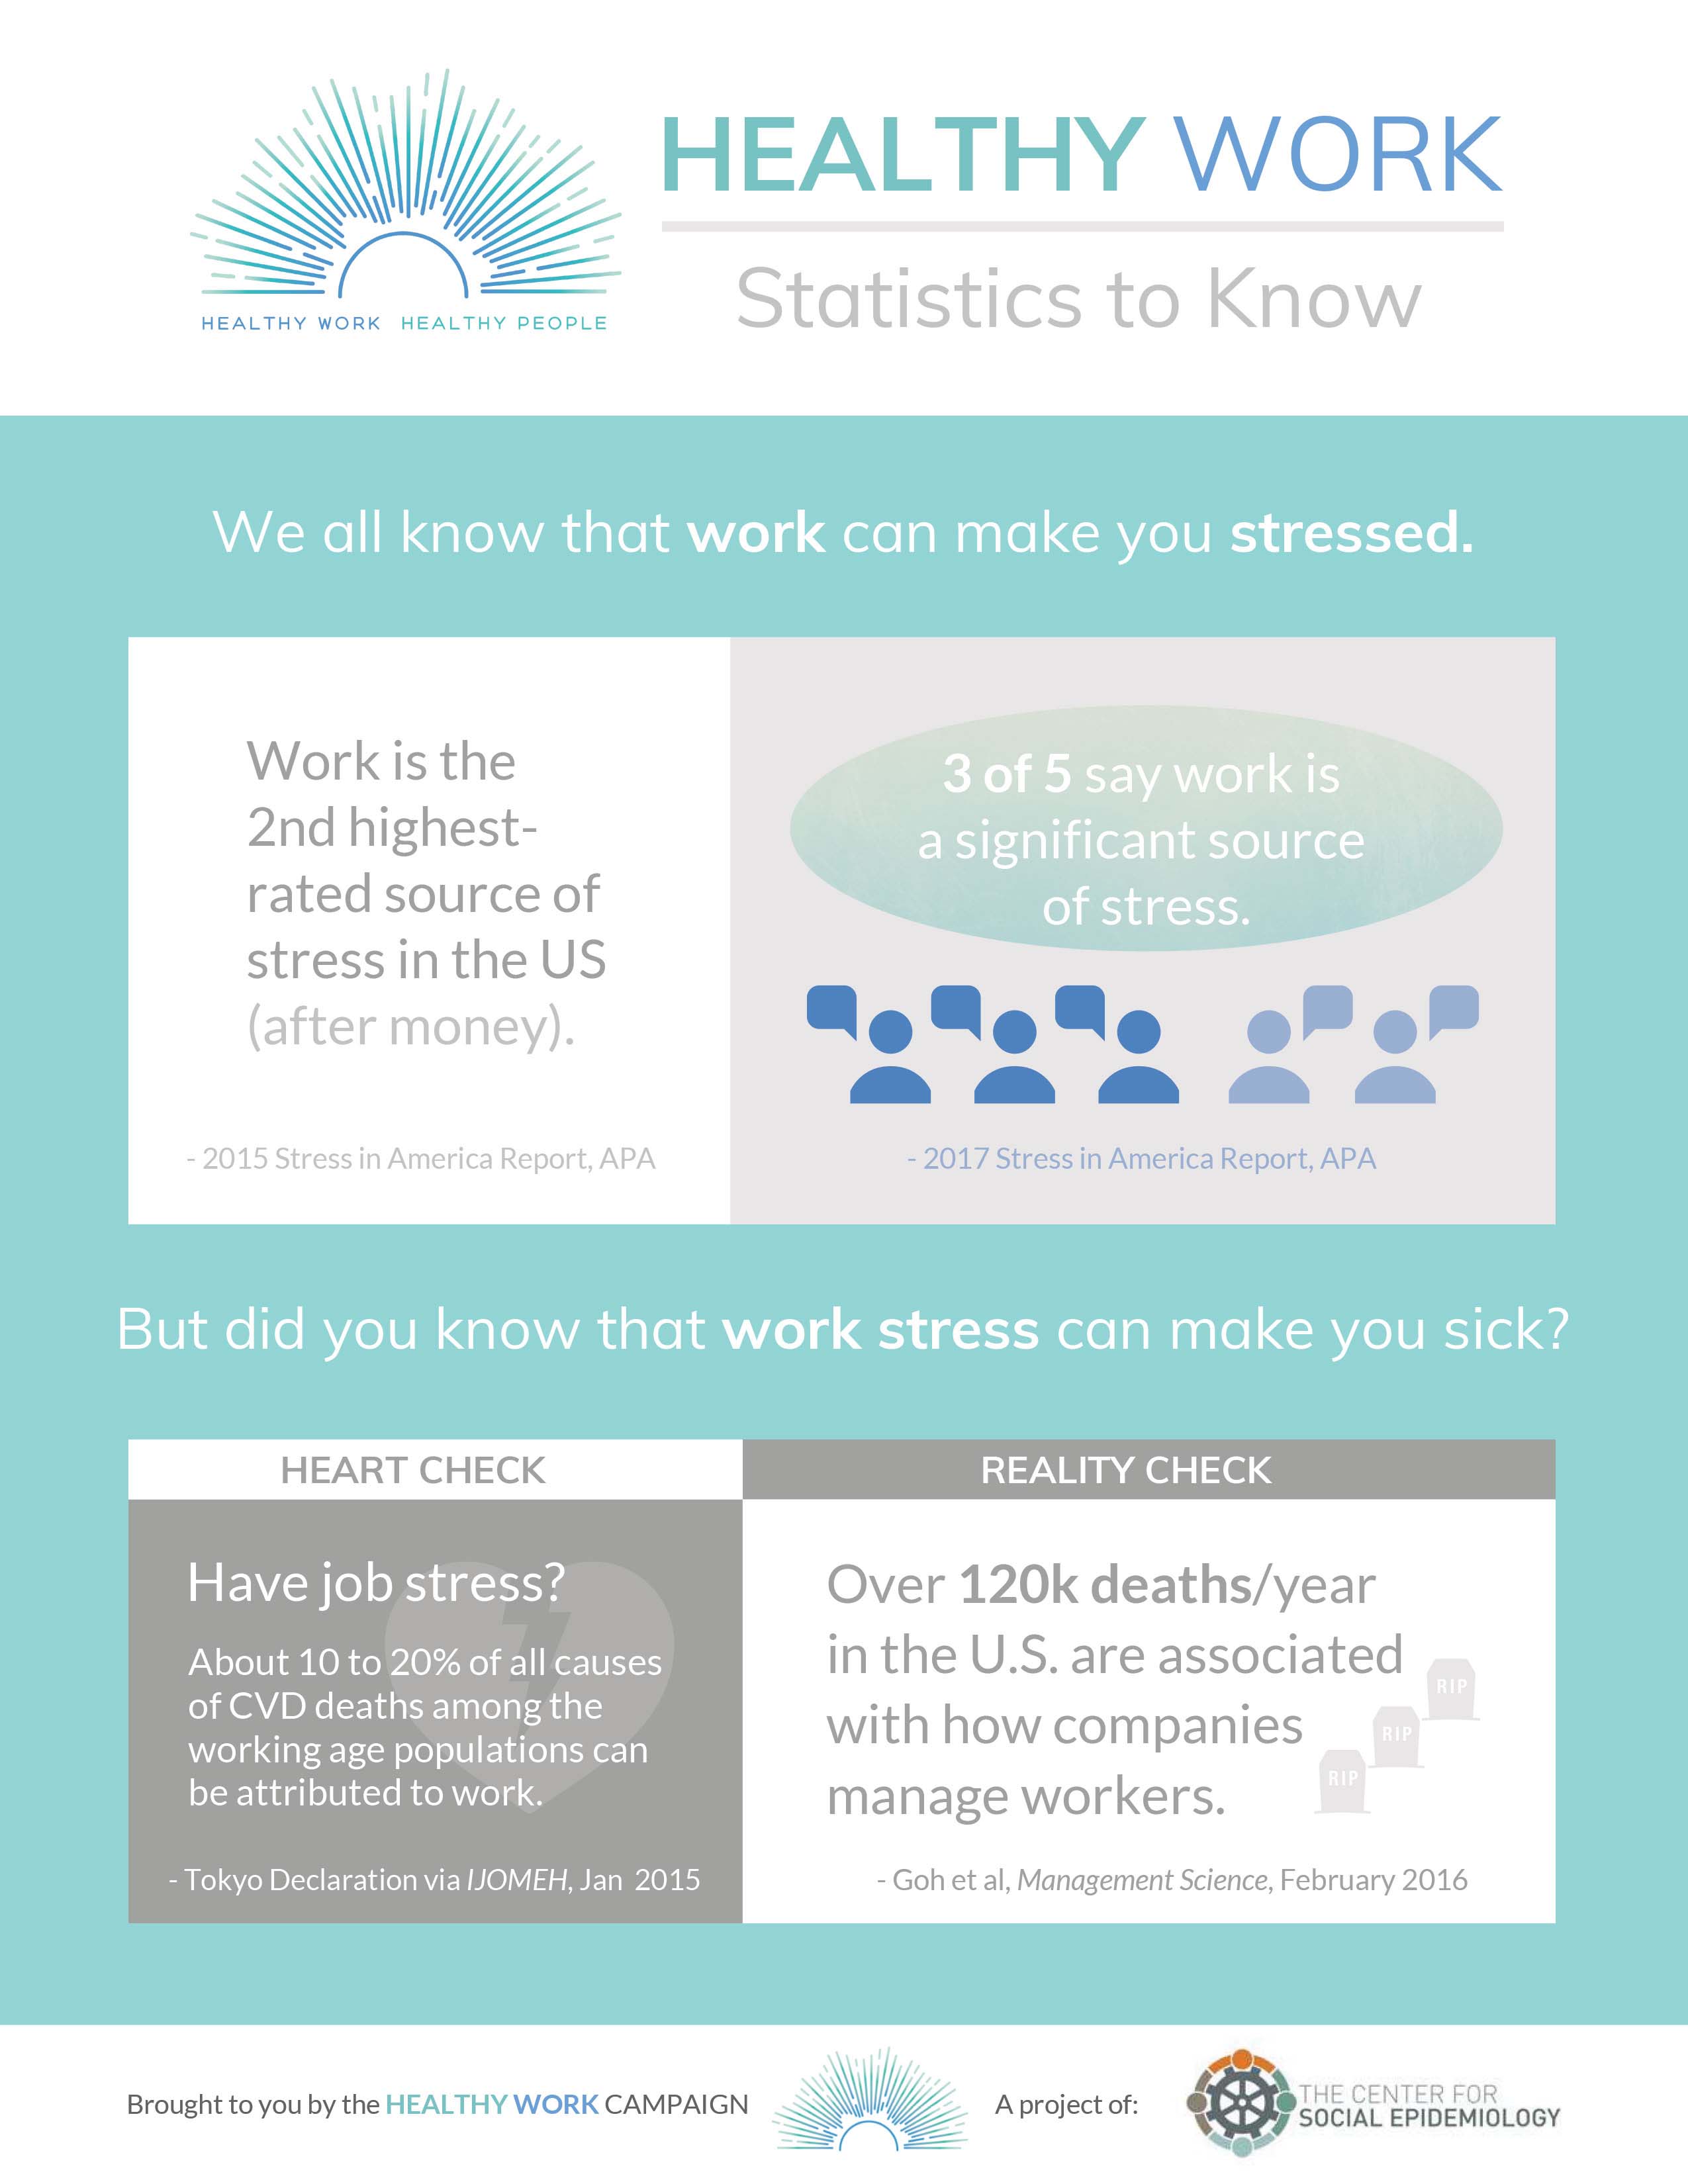
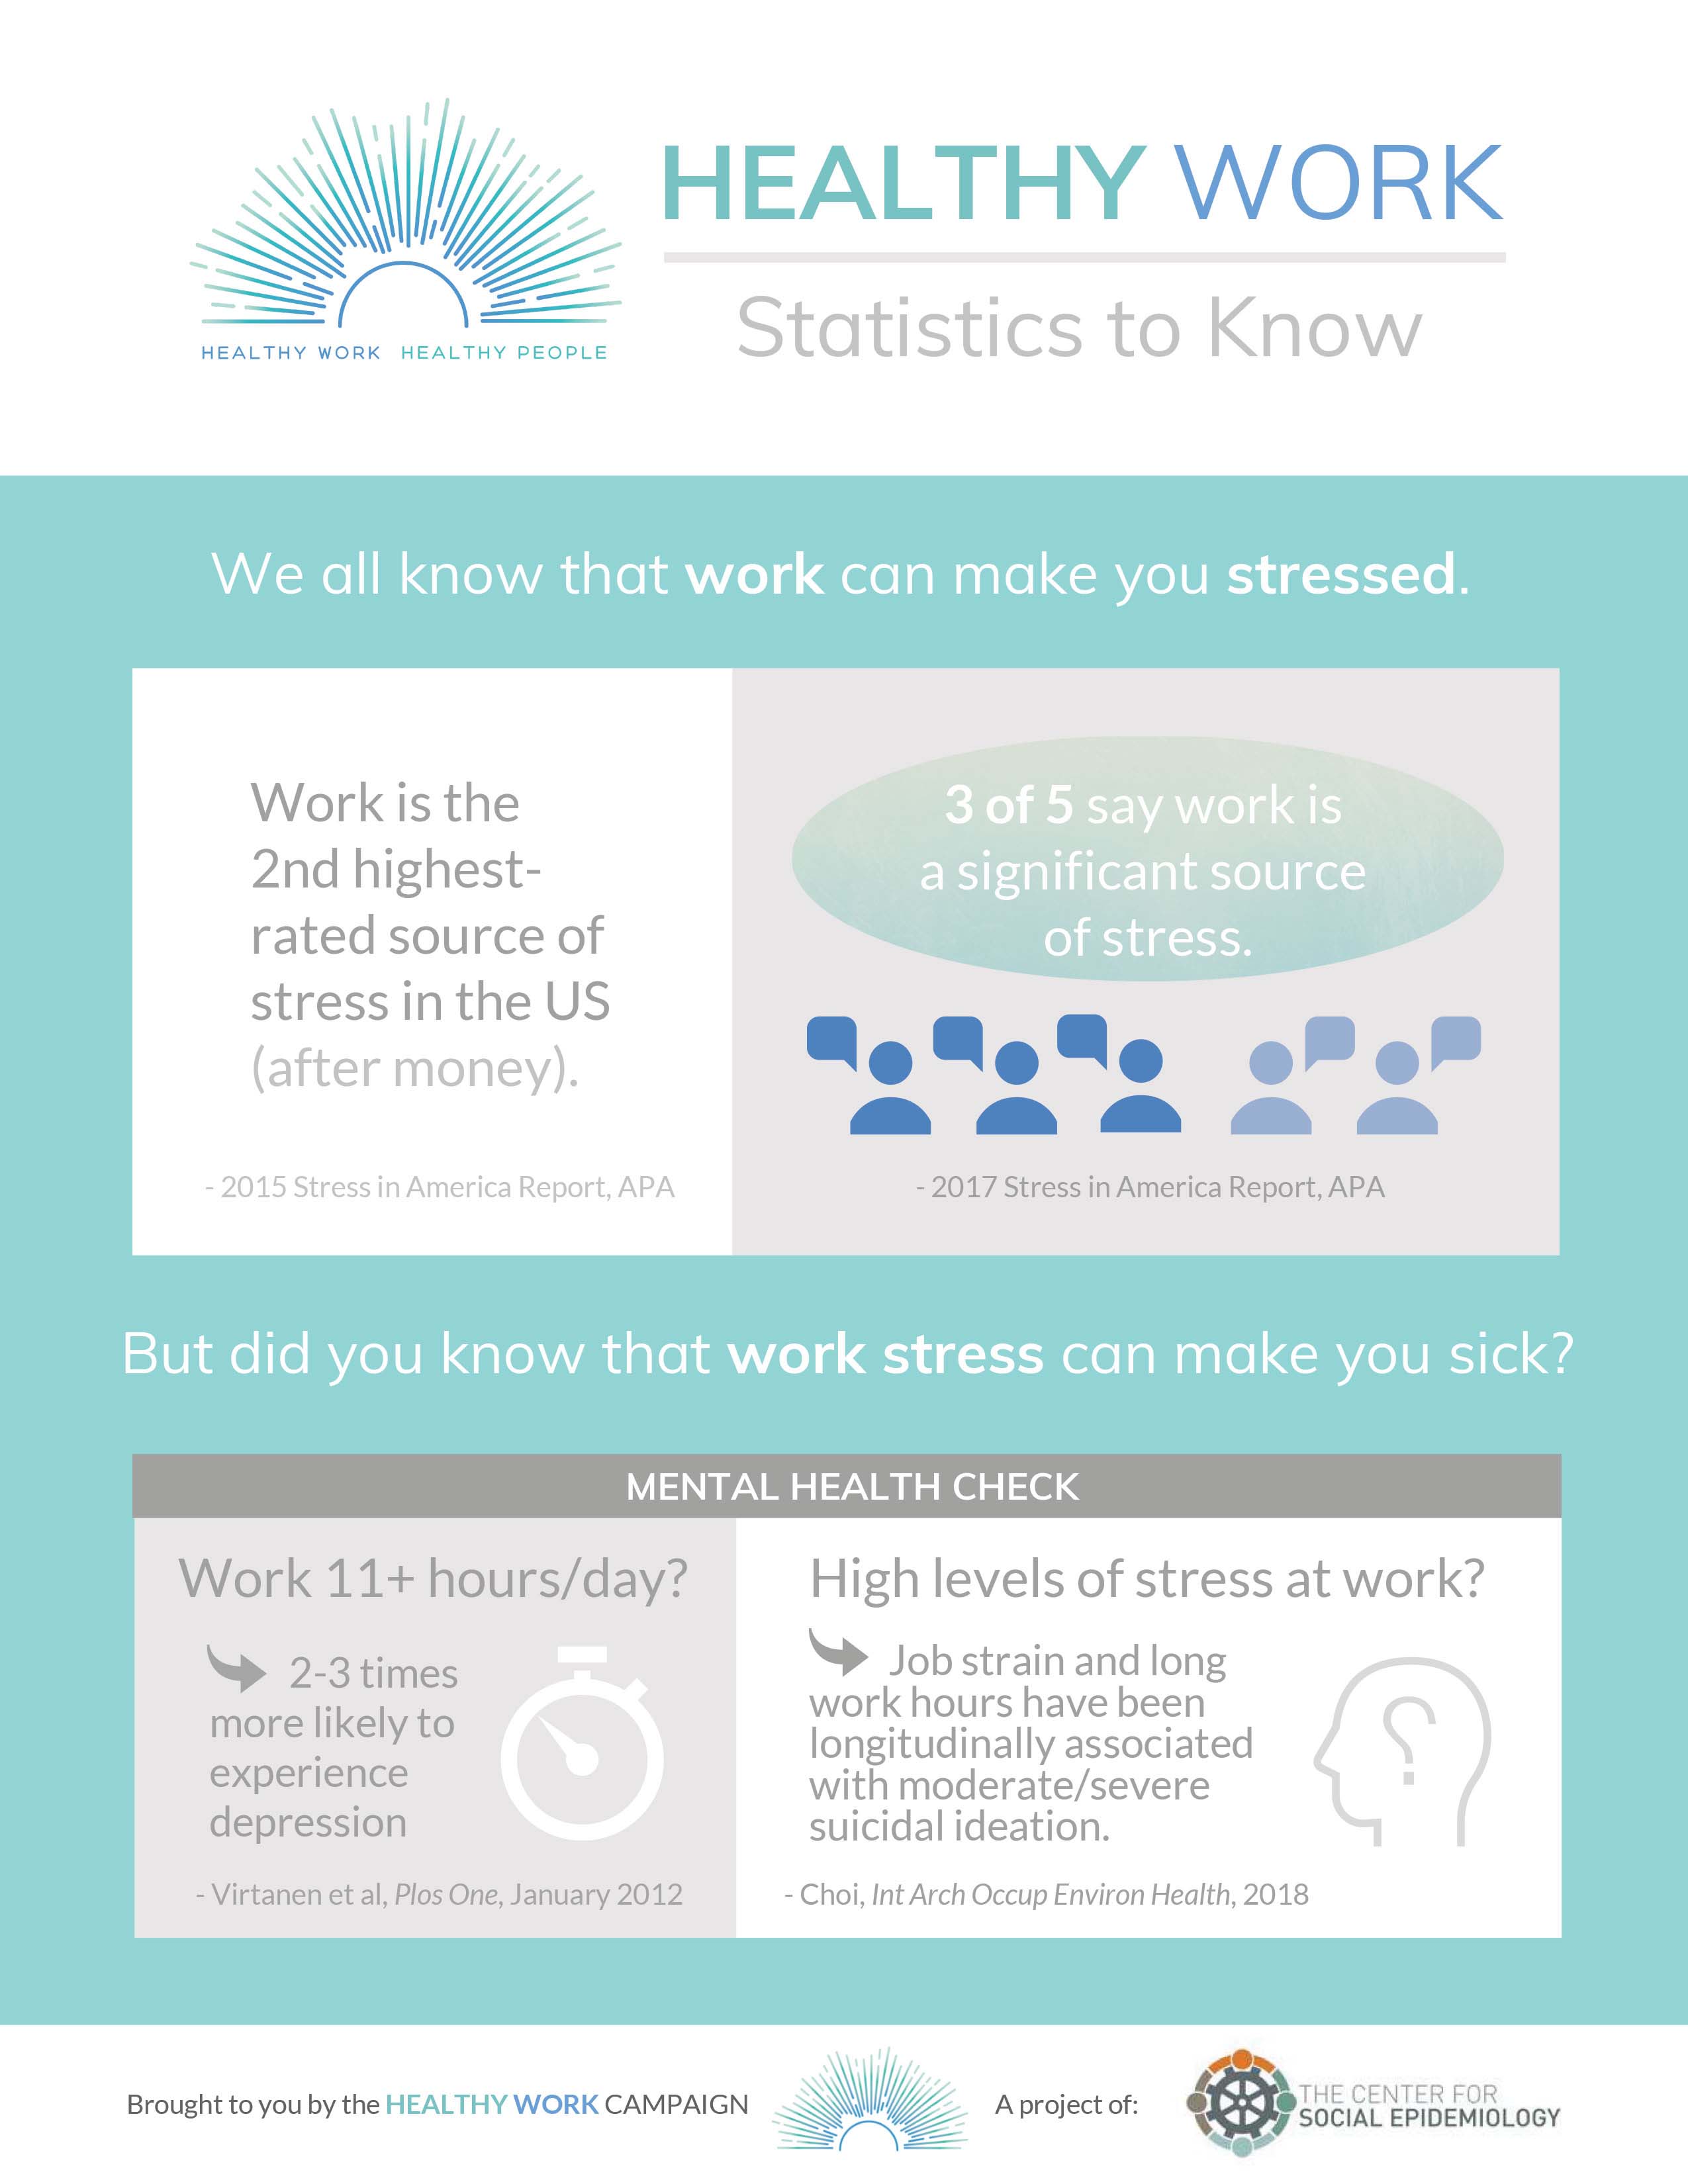
- 3 out of 5 Americans say that work is a significant source of stress. (APA, 2017)
- Those with high levels of work stress (job strain, effort-reward imbalance) are twice as likely to think about committing suicide than those with no or limited amounts of work stress. (JPR, 2016)
- Those working 11+ hours per day are 2-3 times more likely to experience depression. (PO, 2012)
- 10 to 20% of all causes of cardiovascular disease (CVD) deaths among the working age populations can be attributed to work. (IJOMEH, 2015)
- More than 120,000 deaths per year are associated with how U.S. companies manage workers. (MS, 2016)
More #HealthyWork Stats
These statistics are just some examples from over 40 years of scientific research showing the impact of work organization and work stressors, on the health and well-being of working people.
(Please feel free to download & share these stats.)
Work can make us sick.
- Long work hours increase mortality by almost 20%.
- Low job control increases mortality by almost 45%.
- High job demands raise the odds of having a physician-diagnosed illness by 35%.
- Low organizational justice increases the odds of having a physician-diagnosed illness by 50%.
- Job insecurity increases the odds of reporting poor health by about 50%.
- Work-family conflict increases the odds of reporting poor physical health by about 90%.
(Goh et al, Behavioral Science & Policy, 2015)
10 to 20% of all causes of CVD deaths among the working age populations can be attributed to work. (Tokyo Declaration via IJOMEH 1/2015)
“Job Strain,” where workers have little control over their job, but who are under high pressure to perform, accounts for 17 per cent of depression in working women and 13 per cent in working men. (LaMontagne, T et al. Estimating the economic benefits of eliminating job strain as a risk factor for depression. Melbourne: Victorian Health Promotion Foundation, 2010)
People putting in a lot of effort at work while receiving inadequate rewards, are twice as likely to suffer from CVD than other workers. (Siegrist, Psychoneuroendocrinology, 2005)
Those reporting higher levels of unfairness at work were more likely to experience a heart attack. (De Vogli, Journal of Epidemiology & Community Health, 2007)
Employees reporting a high sense of justice in their workplaces had a 45 percent lower risk of dying from CVD. (Elovainio et al, Journal of Psychosomatic Research, 2006)
Shift workers (night shifts, rotating shifts) have an estimated 26% increased risk of CVD compared to day workers. (Torquati et al, Scandinavian Journal of Work, Environment & Health, 2018)
Employees at downsizing firms have been found to get sick at a rate more than two times as high as workers who feel secure in their jobs. (Goh et al, Behavioral Science & Policy, 2015)
“Karoshi” is a term in Japan that recognizes the problem of sudden death from long hours of over-demanding work. (Shimomitsu and Odagiri from: Schnall, Belkic, Landsbergis, et al. The Workplace and Cardiovascular Disease, 2000)
Job strain and long work hours were longitudinally associated with moderate/severe suicidal ideation. (Choi, Int Arch Occup Environ Health, 2018)
Those with high levels of work stress (job strain, effort-reward imbalance) are twice as likely to think about committing suicide than those with no or limited amounts of work stress. (Loerbroks et al, Journal of Psychosomatic Research, 2016)
Those working 11+ hours per day were two and half times more likely to experience a major depressive episode compared to those working 7-8 hours per day. (Virtanen et al, Plos One, 2012)
3–4 hours of overtime work per day is associated with a 60% increased risk of incident coronary heart disease (CHD) compared with employees with no overtime work. (Virtanen et al, European Heart Journal, 2010)
A study from Whitehall compared those working 40 hours per week at most, with those working more than 55 hours per week found lower scores in the vocabulary test at both baseline and follow-up for those working 55 hours a week or more. As well, long working hours predicted decline in performance on the reasoning test. (Virtanen et al, American Journal of Epidemiology, 2009)
Working conditions are getting worse.
Stress levels reported by Americans have increased 30% over the last 30 years. (Carnegie Mellon via NY Daily News, 2012)
40% of Americans who are employed full-time, now work 50 hours or more per week. (Gallup Poll, 2014)
In 2017, Americans worked on average 1,780 hours annually (includes part-time and full-time workers); that’s almost 2 weeks longer than Japanese workers (Japan, 1,710 hours) and over 10 weeks longer than German workers (Germany, 1,356 hours). (OECD Stats)
Since 1980, American workers are putting in an average of nearly four more weeks of work each year—from 43 weeks in 1980 to 46.8 weeks in 2015. (Pew Research Center and the Markle Foundation via CNBC, 2016)
By 2020, over 40% of Americans will work in precarious jobs—those with no job security or benefits (independent contractors) or as part of the “gig” economy. (Newsweek, 2015)
1 in 4 American workers have no paid vacation time* and only 25% of Americans take their full paid vacation.** (*Center for Economic Policy & Research via Forbes, 2013; **Forbes, 2014)
More than half of American workers (52%) left vacation time unused in 2018. This added up to 705 million unused vacation days in 2017. Workers cited ‘fear looking replaceable’ (61%) as the greatest challenge, ‘my workload is too heavy’ (56%) as the second greatest challenge, followed by ‘lack of coverage at work’ (56%) and several others including ‘the cost of travel’ (53%). (Project: Time Off’s State of American Vacation 2018)
What is work stress costing us?
As Individuals
As many as 10 different work stressors (including high work demands, having no power at work (low control), long work hours, shift work, job insecurity, work-family conflict, workplace injustice, etc.) have been related to poor mental (depression) and physical health (heart disease), and can shorten your life by up to 3 years! (Pfeffer, J. Dying for a Paycheck. Harper Business, 2018) (Huffington Post, 2015)
More than 120,000 deaths per year are associated with how U.S. companies manage workers. (Goh et al, Management Science, 2016)
As Organizations
The evidence shows clearly that work-related stress and psychosocial issues lead to increased absenteeism and staff turnover rates, along with decreased productivity and performance. (European Agency for Safety and Health at Work (EU-OSHA), Calculating the cost of work-related stress and psychosocial risks, 2014)
The direct and indirect costs of work-related stress to companies (including increased healthcare premiums, and the added costs to employers from increased absenteeism/sick leave, disability management, diminished productivity at work (presenteeism), and employee turnover) is estimated in the hundreds of billions. (Jauregui and Schnall. Work, Psychosocial Stressors and the Bottom Line. In: Unhealthy Work: Causes, Consequences, Cures. Baywood, 2009)
- Healthcare costs
Approximately 5-8% of annual healthcare costs ($180 billion) are associated with how U.S. companies manage their workers. (Goh et al, Management Science, 2016)
Healthcare expenditures are nearly 50% greater for workers who report high levels of stress. (Goetzel et al, J Occup Environ Med, 1998)
- Sickness absenteeism
When all forms of stress (including the impact of long hours, lack of commitment, personal problems and low workplace morale) are included, stress accounts for 40% of sickness absence, at an estimated average cost of £175 (U.S.$ 228) per employee/year. (Hoel, H., Sparks, K. and Cooper, C.L., International Labour Organization (ILO), Geneva, 2001)
In the United Kingdom, in 2015/16, over 11 million days are lost at work a year because of stress at work and 24 working days are lost per person. (UK Health and Safety Executive, Health and Safety at Work: Stress, anxiety and depression statistics, 2015/16)
In a Finnish study of 5,000 hospital staff, targets of bullying had on average 50% higher certified sickness absenteeism than those who were not bullied. (Kivimäki, Occupational and Environmental Medicine, 2000)
- Presenteeism
Presenteeism accounts for 58.4% (32.4% is due to absenteeism) of the overall cost to British employers of stress, anxiety and depression. Therefore, presenteeism costs a company with 10 employees an estimated £6 050 per year. (Sainsbury Centre for Mental Health, Mental health at work: developing a business case policy paper, 2007)
With higher levels of reported job stress (including understaffing because of absences/vacancies, having ‘‘too many’’ clients, time pressure, and “too much work”), sickness presenteeism occurred more often than sickness absence among elder care workers. (Elstad, Scan J Pub Health, 2008)
- Accidents and Injuries/Workers Compensation
Among employees who state that they ‘always work under pressure’, the accident rate is about five times higher than that of employees who are ‘never’ subject to pressurised work. (European Foundation for the Improvement of Living and Working Conditions, Work-related stress, 2007)
High psychological demands, emotional demands, and conflicts with supervisors and coworkers increased the risk of being injured in an occupational accident even taking into account demographics, fatigue, shift work and type of work environment. (Swaen et al, J Occup Environ Med, 2004)
- Disability Management
In a cohort study of over 40,000 employees, the combination of job strain and ERI was associated with doubling the risk of disability due to depression. (Juvani et al, SJWEH, 2018)
A higher job strain score was associated with a 1.3-2.4 times higher risk of disability pension due to musculoskeletal disorders four and half years later. (Mantyniemi et al, Occup Environ Med, 2012)
- Turnover
National studies show that about a fifth of staff turnover can be related to stress at work. (CIPD Recruitment, retention and turnover, 2008 in European Agency for Safety and Health at Work (EU-OSHA), Calculating the cost of work-related stress and psychosocial risks, 2014)
The cost of voluntary white-collar turnover is estimated to be at least a year’s compensation for the position. (Ramlall, S. Journal of the American Academy of Business, 2004)
A meta-analysis of 46 telecommuting studies shows telecommuting to be related to lower turnover intentions. (Gajendran & Harrison, Academy of Management Proceedings, 2006)
Infographics
The Healthy Work Campaign has also created #HealthyWork infographics to distill and visualize our most important #healthywork statistics for you to share easily in your work, your organization and your community. You are welcome to share these infographics on social media, in your wellness programs, and at work.
Click infographics to view enlarged or download.
Healthy Work is Good for Business

Healthy Work Pledge (English)

Healthy Work Pledge (Spanish)

Top Ten Causes
of Work Stress

10 Reasons Businesses
Should Combat Chronic
Work Stress

5 Reasons Employers
Should Address
Work Stress

Is Work Stress Hurting
Your Company?

Healthy Work Survey
for Organizations

Healthy Work Survey
for Unions

Stats to Know:
Top Physical Health Stats
Stats to Know:
Top Mental Health Stats
Stats to Know:
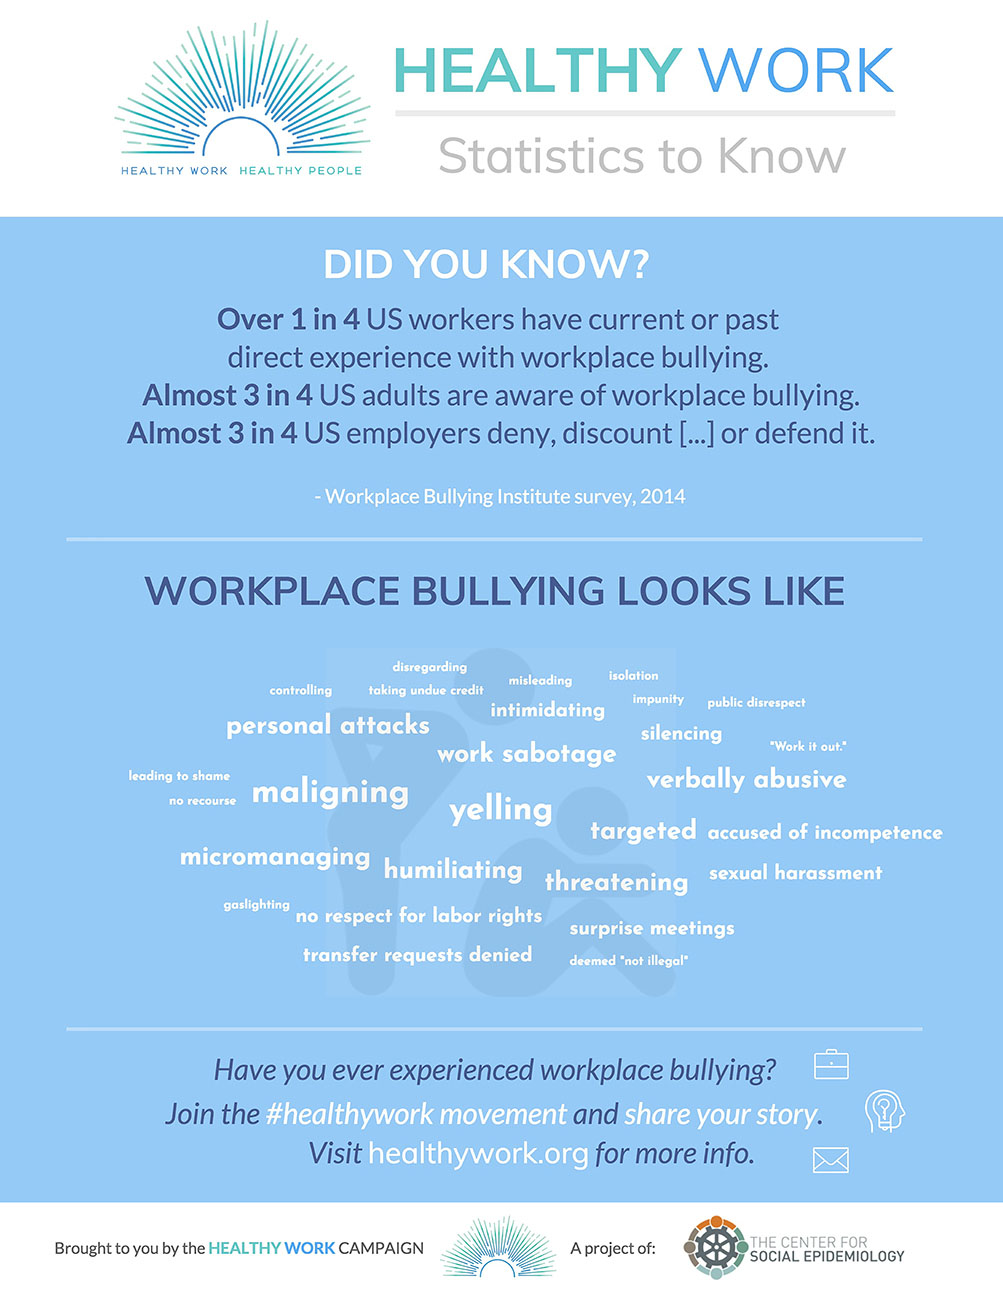
Workplace Bullying
BLACK LIVES MATTER!
Race, Inequality & Health

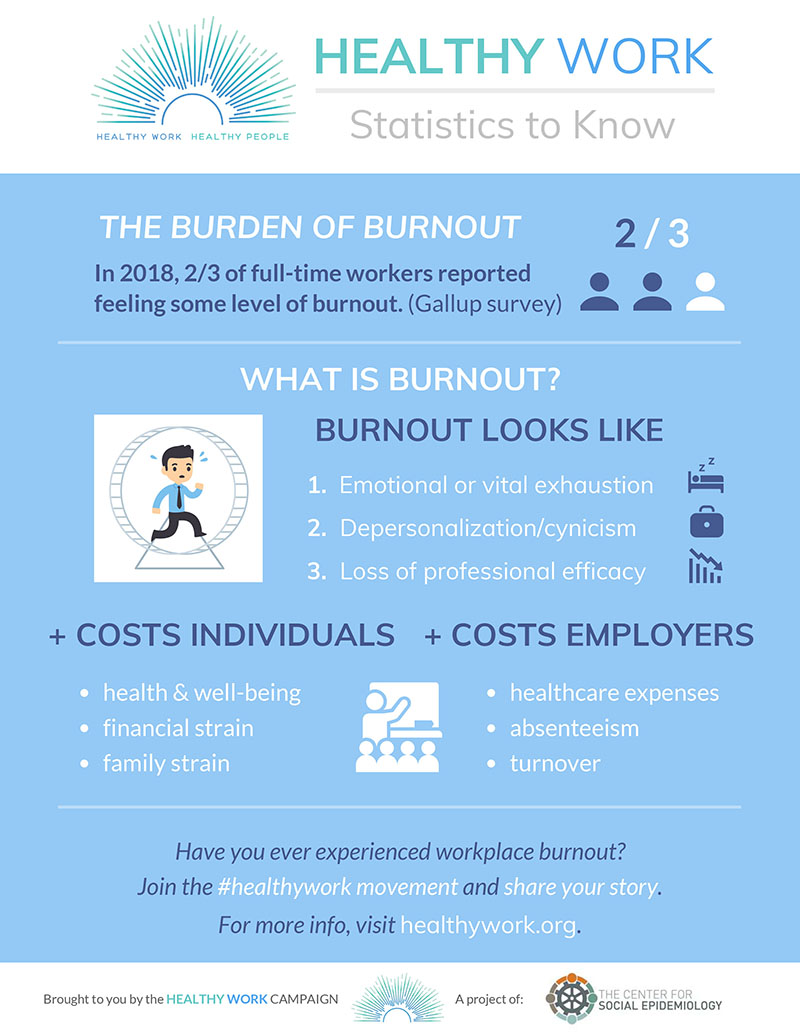
Stats to Know:
The Burden of Burnout